Every dashboard is live, interactive, and built for decision-makers not analysts. Change an assumption, the numbers move. Walk into any management meeting ready to answer anything.
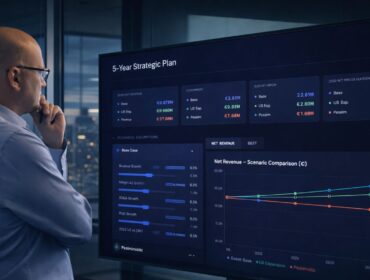
An interactive scenario planning tool for real-time financial forecasting and marketing budget analysis across three strategic paths.
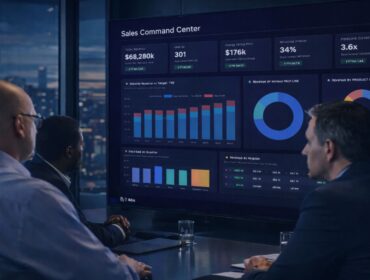
A dynamic sales planning tool for pipeline management, quota tracking, and revenue scenario modelling across teams and regions.
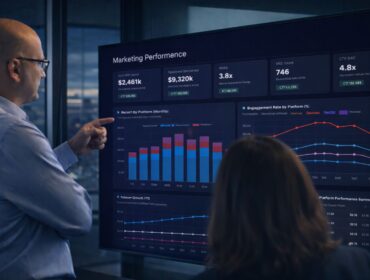
An interactive marketing analytics tool for tracking campaign ROI, budget allocation, and customer acquisition across channels in real time.
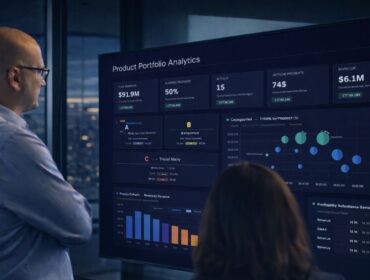
An interactive product performance tool for monitoring feature adoption, user engagement, and growth metrics across the product lifecycle.

An interactive people analytics tool for headcount planning, compensation modelling, and organisational cost forecasting across hiring scenarios.
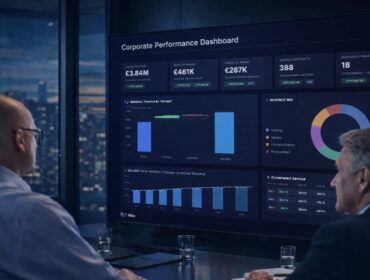
A board-ready financial control center consolidating P&L, cash flow, and balance sheet metrics across all business units with live scenario capability.
Your data is already telling a story. Our AI dashboards make sure you and every decision-maker in the room can read it, react to it, and act on it in real time. No BI team. No waiting. No excuses.
We use essential cookies to ensure the proper functioning of this website. With your consent, we also use analytics and marketing technologies (e.g. HubSpot, YouTube) to improve user experience and measure engagement. You can adjust your preferences at any time.